Interactive map of Stockholm's preliminary Riksdag result
On Sunday, Sweden voted. While I was looking at the results I was struck by how strong the Green Party is in our neighbourhood.
Looking at these results, I thought to myself that regardless of your political views, I guess it’s nice to live in a neighbourhood where people are concerned about their environment.
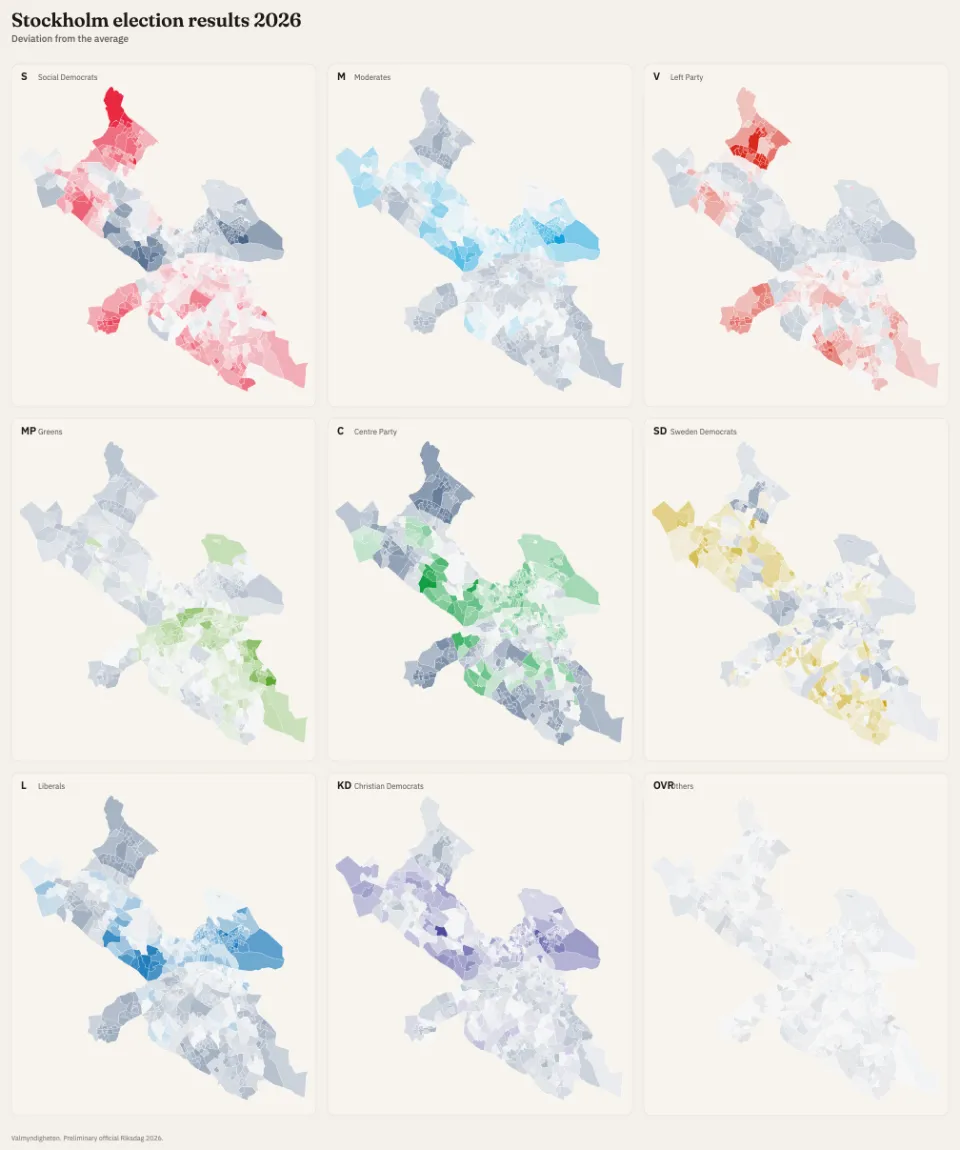
With that, I became curious about the distribution of the votes in each district. Not just the numbers, but the average compared to the rest of the city. My idea was that it should give a clearer picture of what to expect in each area.
The municipality maps on SVT were helpful, but they were only giving me numbers for a single district.
So all this put the idea in my head to create my own map. But there were two problems:
- I had no idea how it is done. I mean those cool interactive maps that you get to select separate states and districts.
- Where to get the data from?
The second question turned out to be an easy one. val.se In Sweden all this data is easily and publicly accessible (one of the better things about living in a transparent, digitalised democracy).
As for the first question, with some searching I learned about the shapefiles, and luckily that data for Stockholm was also readily accessible.
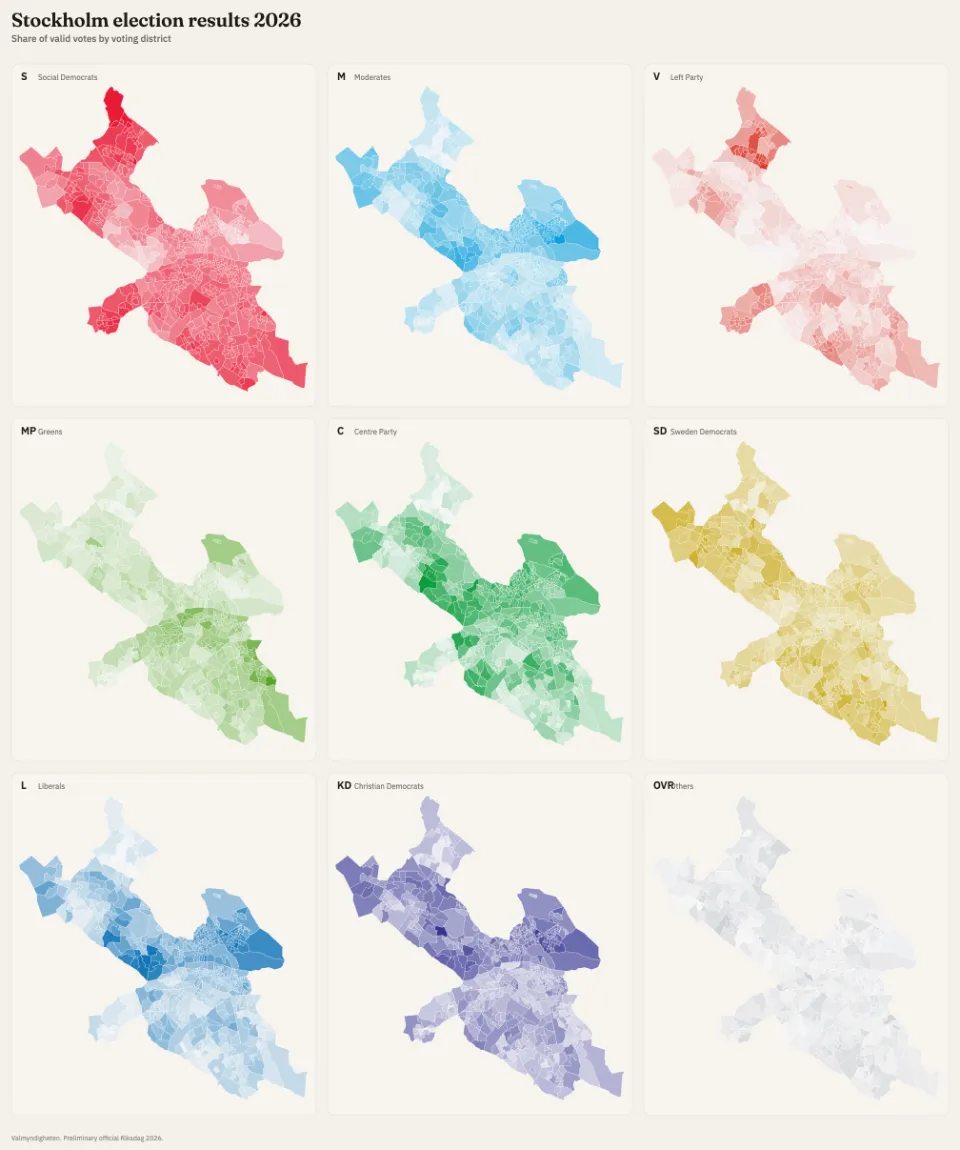
So with this information, I decided to use an AI agent and see if making the map is possible. I had never tried Grok Build, so I gave it a try. After a bit of a struggle, here’s what I got for the preliminary Riksdag result, district by district, in the City of Stockholm:
https://election-2026.arashtaher.com/
Nice thing about this map is that you can also export images.
Here’s the map of the distribution of votes in each district:
And here’s the average votes of each party compared the rest of the districts:
There is plenty you can read off the map. I will leave those interpretations to you. I hope you enjoy it.
Figures are preliminary (election-night count).